The benchmarking data that can lead your team to success


How the Customer Success team at Productboard is helping customers look at performance through industry benchmark data
Editor’s note: This article was written by Daniel Tuohy, Customer Success Manager, Enterprise
In our recent 2022 Product Excellence Report, we partnered with Product Collective to survey over 1,400 product managers and leaders to better understand the current state of product management. We found that 57% of respondents have an increased focus on driving innovation and building the right products. But how can product teams be sure that they are building what their customers actually want? The same report also shared that in these times of uncertainty, nearly half of product teams surveyed said that they have an increased focus on driving efficiencies across the product organization – but how can they show that they are?
The Customer Success team at Productboard undertook a huge amount of work in 2022 to help our customers answer these difficult questions. At Productboard, our ultimate goal is to help our customers get the right products to market faster, so we wanted to be able to help our customers understand if they were in fact getting the right products out and, if so, at what speed?
Our CS team developed new resources, including a customer benchmarking dataset based on over 5,000 global customers, enabling better understanding of industry performance. With this data – derived mostly from private tech companies – our customers are able to learn about best practices from peers. For example, understanding how efficiently they’re moving features through their product development life cycle compared to other customers in their industry.
How we help customers understand the impact of their work
If you are a product manager or product leader you’re responsible for driving business outcomes. Yet, it seems achieving these outcomes is increasingly challenging. In a thought leadership paper surveying 500+ product decision makers, conducted by Forrester Consulting on behalf of Productboard, it was found that achieving key business goals – such as increasing customer retention or speeding up product development life cycles – is more challenging now than it was even two years ago. The CS team is dedicated to helping our customers with this challenge by giving them new resources and data that can show them the business impact their product teams are driving.
Sentiment Survey
The CS team created a simple survey to help our customers measure how their product teams spend time on our platform. We encourage them to share the survey before and after major changes – e.g. before and after product onboarding. This survey enabled customers to track reductions in the number of hours that their product teams were spending on regular work activities (e.g. building roadmaps) which they could reference to show that their teams were becoming more efficient, helping to reduce operational expenditure.
You can access the template here.
Benchmark Data
Background
The CS team at Productboard see the most successful customer product teams drive the most business impact when they excel in the following three areas:
- Building a Voice of Customer Program: Ability to use customer feedback and insights to drive product decisions
- Building Organisational Alignment: Increase visibility and collaboration to improve internal alignment and a unified vision of product direction
- Drive Product Efficiencies: Increase efficiency of product team and have more time for high value tasks
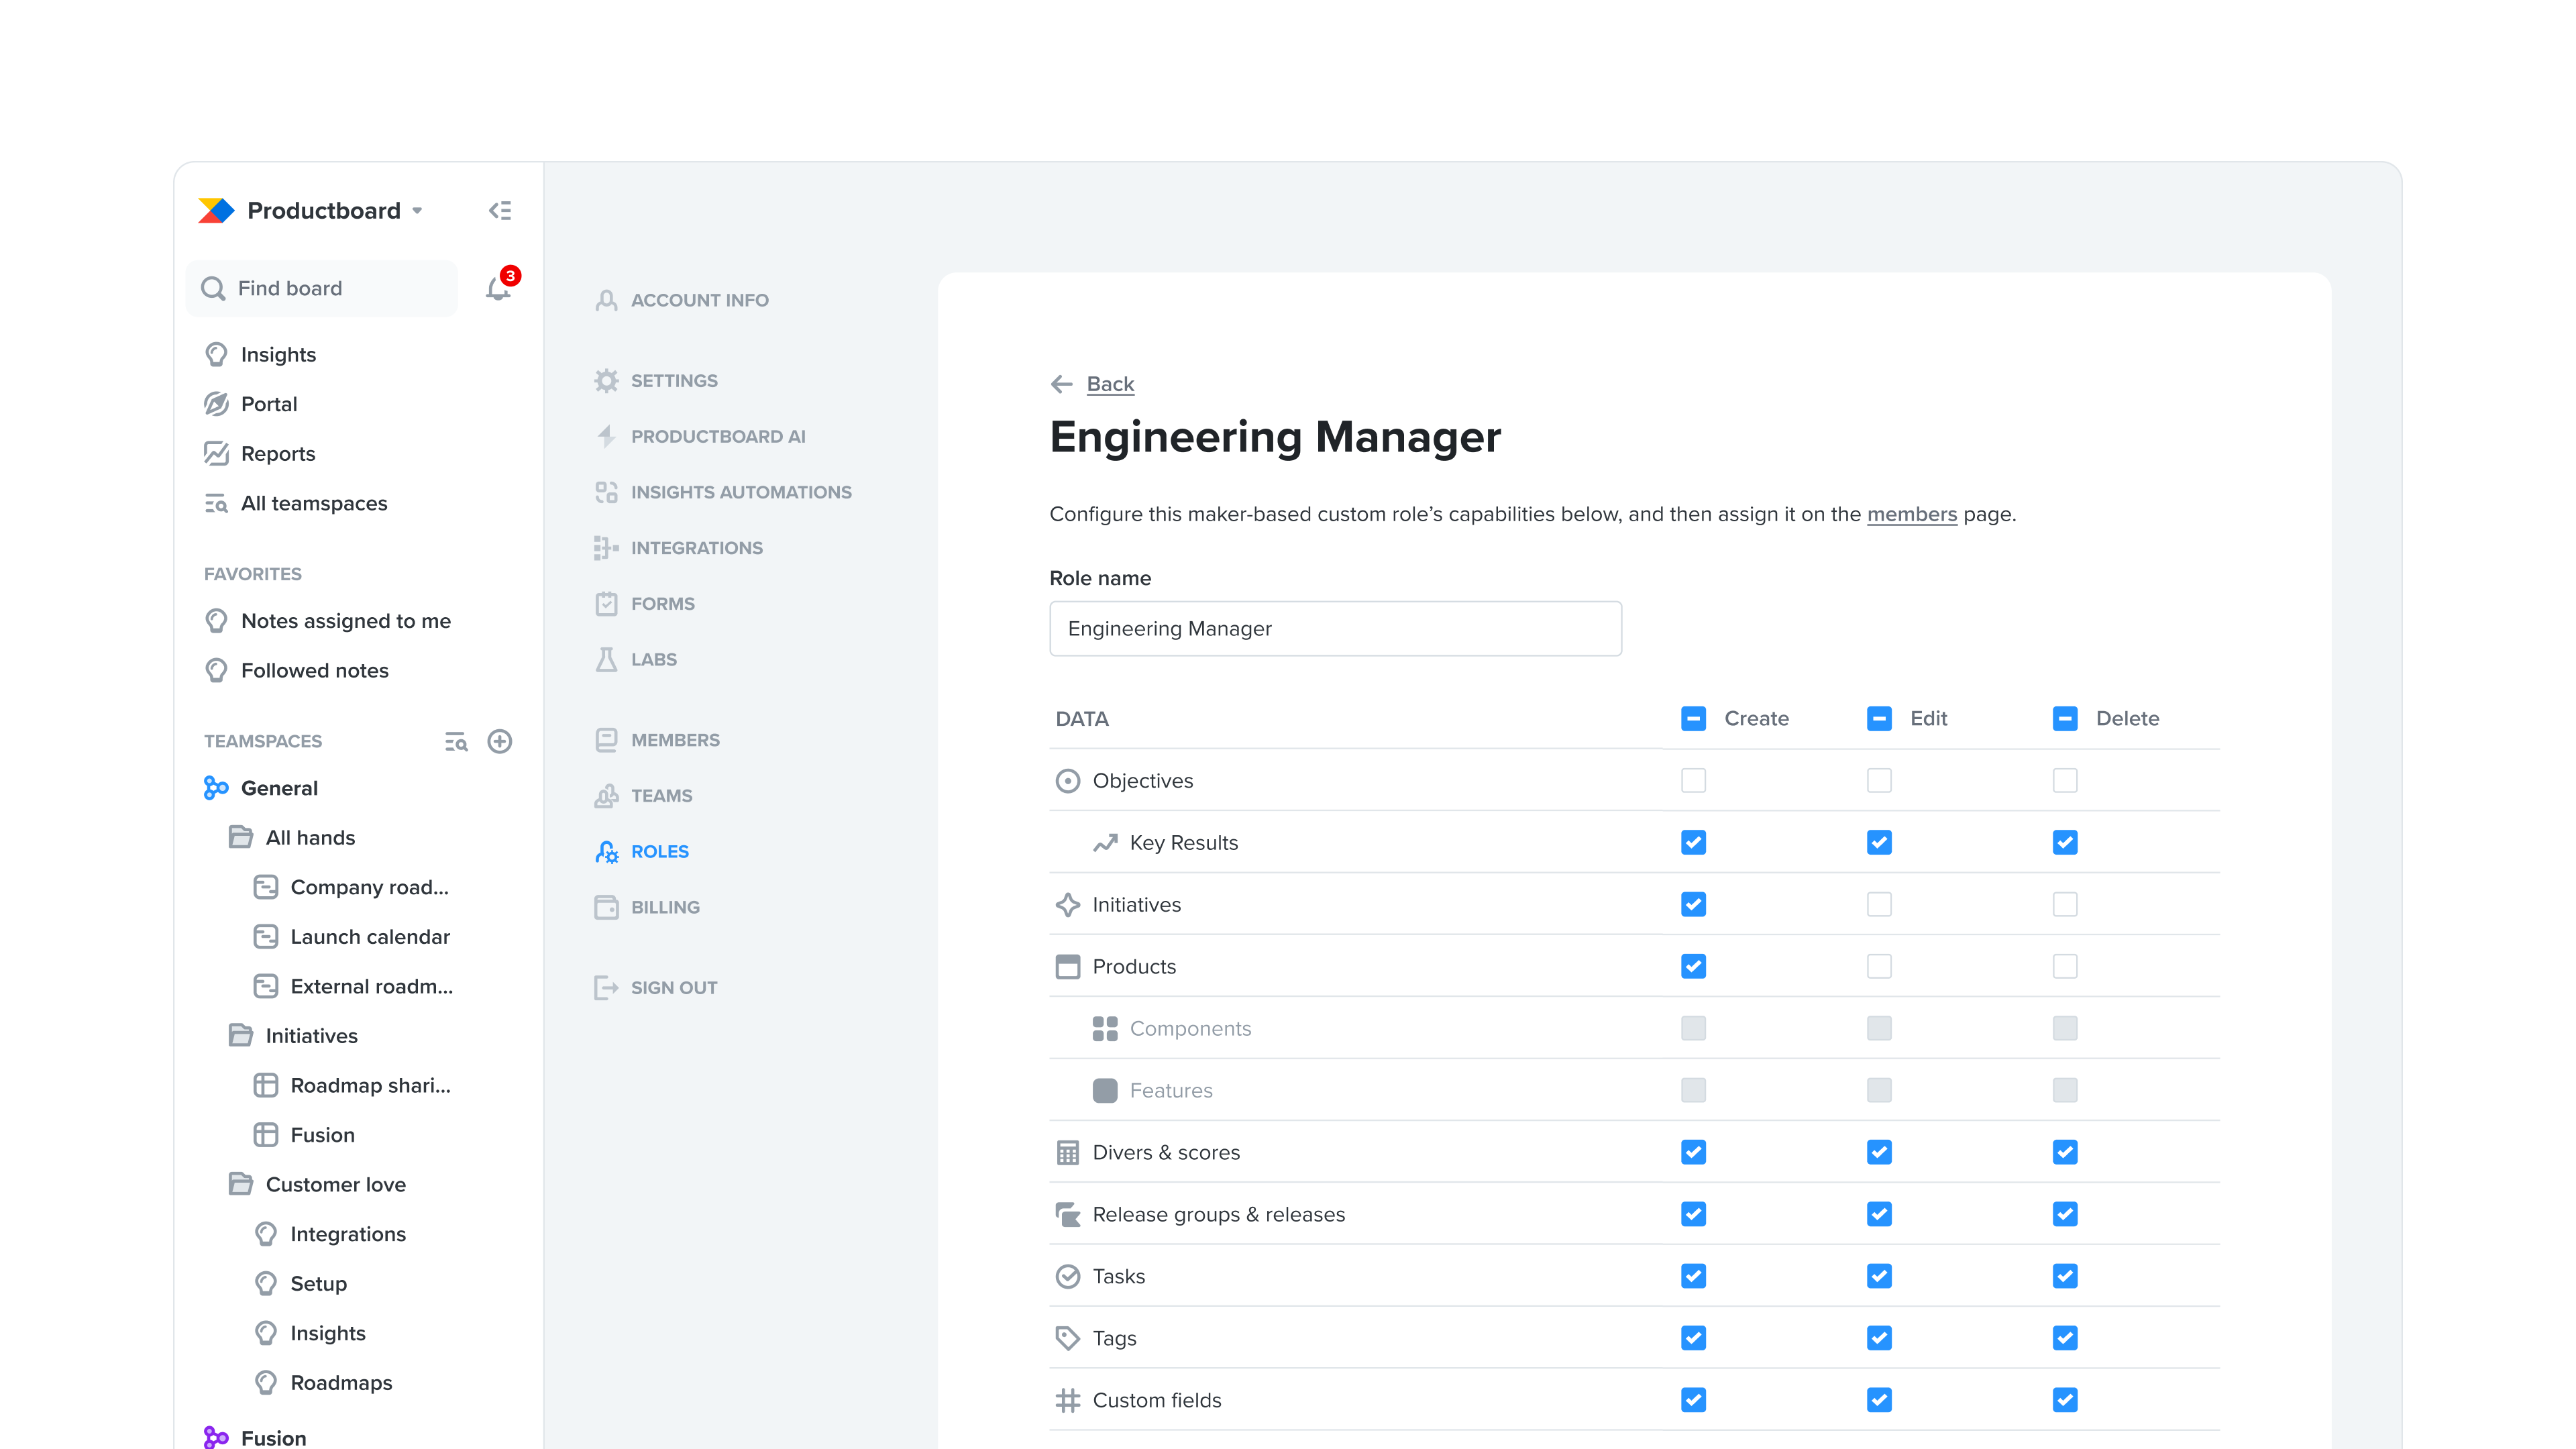
Our platform supports product teams to excel in these areas and different data points help demonstrate if product teams are performing as expected. For example, customers can access our Efficiency Report right inside Productboard which helps them identify which features are taking the longest to bring through their process or where bottlenecks exist. This data can help our customers optimize their process, perhaps helping them bring products to market faster.
To supplement some of the self service data that is available within Productboard, Carolyn Thompson, a Senior Value Manager at Productboard, worked with our CS team and data analytics teams to help create a brand new customer benchmark dataset.
There is not much information available on what good product management looks like, so we wanted to take advantage of the insight we have into 5,000+ product orgs that are leveraging Productboard today. By normalizing the data and looking across a wide range of company sizes, industries, and locations we were able to get an idea of benchmarks for some key areas in product management. The goal of this data is to help our customers understand where they are at compared to other companies and help them identify areas of opportunity.
— Carolyn Thompson, Senior Value Manager at Productboard
Benchmarking data explained
The benchmark data is refreshed on a periodic basis and consists of a number of data sets based on Productboard’s approximately 5,000 customers; currently the data is skewed towards smaller tech companies. Each data set focuses on particular events or activity within our platform related to the three areas previously described. The data was normalized by looking only at ratios or percentages and not absolute numbers.
To determine what good or great looks like, we grouped the data into quartiles, designating the top quartile as “top performers”. For example, one data set looks at the number of Features shipped from Productboard that are linked to Objectives (most commonly used to track company wide objectives or larger team initiatives inside Productboard). Customers who are using Objectives in Productboard are more likely to be building organizational alignment, therefore, we hypothesized that companies who have the highest percentage of shipped Features with linked Objectives are top performers (top quartile).
The CS team have used the benchmark data to help many customers understand how their product management performance compares against peers, enabling them to better understand not only their own performance, but give them more confidence to demonstrate to key stakeholders the impact that they’re having against business goals.
Example 1: Features with Insights Attached
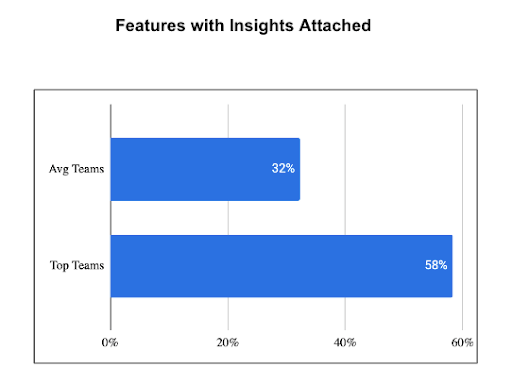
Similar to the example above, another benchmarking data set looks at the number of Features shipped from Productboard that are linked to Insights (mainly used in Productboard to capture insights related to a product such as customer feedback). Customers who are frequently linking Insights to Features in Productboard are more likely to have a more complete understanding of their customers, enabling them to use this data to make better prioritization decisions which can lead to better products their customers actually want.
In this example, you can see that companies deemed top performers have 58% of Features with Insights attached, while companies that are average have only 32% of Features with Insights attached.
Example 2: Efficiency in the Product Lifecycle
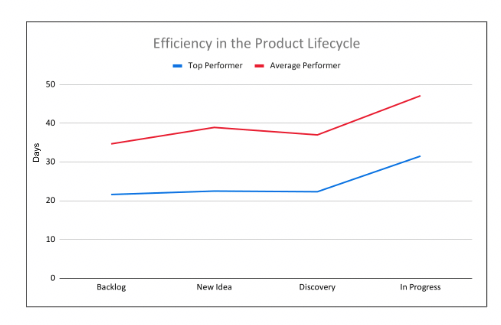
In this example, the benchmarking data set looks at the number of days it takes a feature to go from “Idea” to “Released” when looking at the typical product development stages. Generally speaking, Productboard customers who are able to move features through their process faster are able to bring products to market earlier, delivering more value to their own customers in less time.
The benchmarking data found that customers deemed top performers are able to get features to market 60 days faster than average performers. As mentioned earlier, our customers can access our Efficiency Report right inside Productboard which provides them with similar data about their own process so they can see how features are moving through their own product development life cycle. With this type of data, our customers can get a better sense about how other customers are doing in their industry or deep dive into their own data to help find opportunities to become more efficient.
Conclusion
The CS team has only recently started to leverage this benchmarking data with our customers and it has helped our customers better understand where opportunities exist to improve their performance and drive more impact for their business. In the future, as the benchmark data evolves and grows, we would potentially like to introduce segmentation so customers would have the opportunity to benchmark themselves against even more similar customers (e.g. by company size, by industry).
Finally, our product team is currently working on bringing more self-service data to our customers in Productboard with Allocation Reports (see data which helps you understand where your teams are investing resources) and Progress Reports (see data which helps you understand how your teams are tracking against planned work). Looking ahead in 2023, our product team is also working on new capabilities which will help product teams tangibly show the impact they are having in certain areas and be able to close the feedback loop even more effectively.
For example, very soon users will be able to evaluate survey results directly in Productboard after features have launched to capture CSAT or NPS to help product teams better understand how well their features have landed with their customers.
When starting the evaluation of a product’s success you are usually covering three main areas — revenue (ie. MRR or ARR), user activity (typically DAU/MAU), and user satisfaction (CSAT or NPS); the key is the periodic evaluation and collection of all three areas to get your internal product benchmark.
— Michael Stencl, Director of Product at Productboard