Introducing Productboard Pulse. Exec-level insights into what your customers need, powered by AI.
Learn morePrioritization in product management is the disciplined process of evaluating the relative importance of work, ideas, and requests to eliminate wasteful practices and deliver customer value in the quickest possible way, given a variety of constraints.
The reality of building products is that you can never get everything done — priorities shift, resources are reallocated, funding is scarce. As product managers, it’s our job to make sure we’re working on the most important things first. We need to ruthlessly prioritize features before we run out of resources.
"Opportunity cost is when you never get the chance to do something important because you chose to work on something else instead." - Product Roadmaps Relaunched by C. Todd Lombardo, Bruce McCarthy, Evan Ryan, Michael Connors
An effective product prioritization process garners support from stakeholders, inspires a vision in your team, and minimizes the risk of working on something that nobody wants.
In a 2016 survey conducted by Mind the Product, 47 product managers named the most significant challenge they face at work. While this data sample is too small to make this a statistically significant report, the results will sound painfully familiar to you if you are a product manager.
The biggest challenge for product managers is: Prioritizing the roadmap without market research.
A staggering 49% of respondents indicated that they don’t know how to prioritize new features and products without valuable customer feedback. In other words, product managers are not sure if they’re working on the right thing.
Due to the lack of customer data, we often fall into the pitfall of prioritizing based on gut reactions, feature popularity, support requests or even worse—going into an uphill feature parity battle with our competitors.
Luckily for us, there is a more scientific way to prioritize our work.
Product prioritization frameworks are a set of principles; a strategy to help us decide what to work on next.
The right prioritization framework will help you answer questions such as:
In this post, we’re going to introduce you to seven of the most popular prioritization frameworks.
A value vs. Complexity Quadrant is a prioritization instrument in the form of a matrix. It is a simple 2 x 2 grid with “Value” plotted against “Complexity.”
To make this framework work, the team has to quantify the value and complexity of each feature, update, fix, or another product initiative.
If you can get more value with fewer efforts, that’s a feature you should prioritize.
Value/Complexity = Priority
When aligned together, the criteria makes up several groups (or quadrants) that objectively show which set of features to build first, which to do next, and which to not do at all.
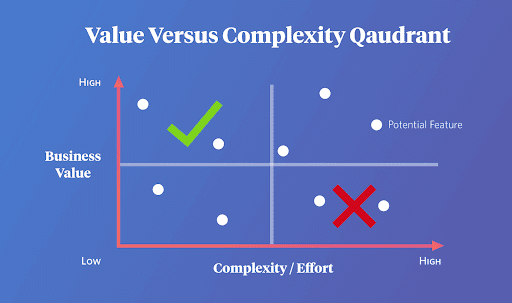
The quadrants created by this matrix are:
The Value vs. Complexity Quadrant is an excellent framework to use for teams working on new products. Due to its simplicity, this framework is helpful if you need to make objective decisions fast. Also, if your team lacks resources, the Value vs. Complexity Quadrant is an easy way to identify low-hanging-fruit opportunities.
The drawback of the Value vs. Complexity diagram is that it can get quite busy if you’re working on a super mature product with a long list of features.
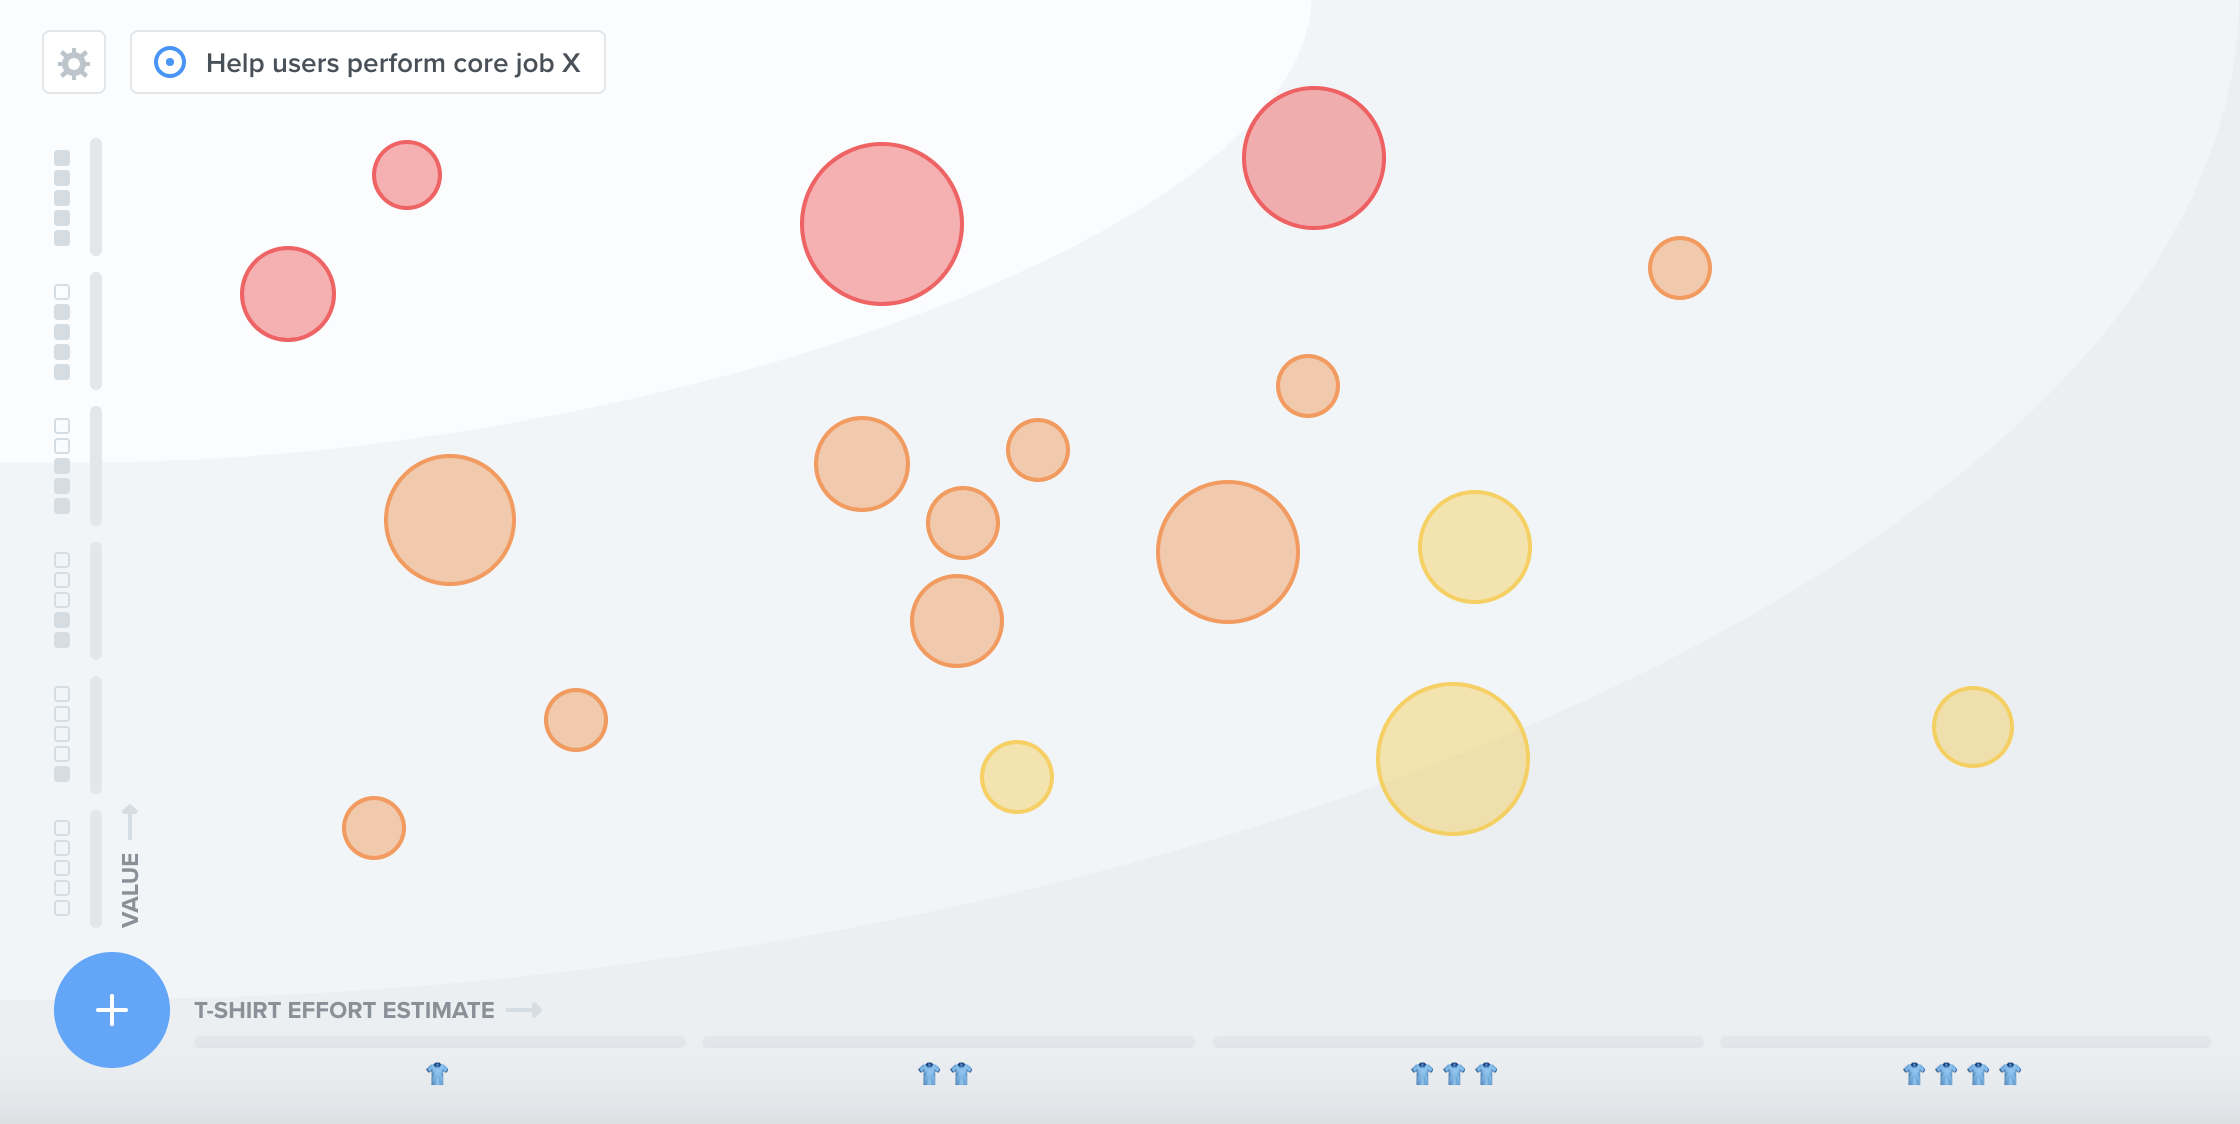
In Productboard, the Prioritization matrix is an interactive visualization that helps you prioritize features within an objective by visualizing each feature’s value and effort. Just drag and drop features vertically to indicate their value to an objective, and horizontally to indicate estimated effort.
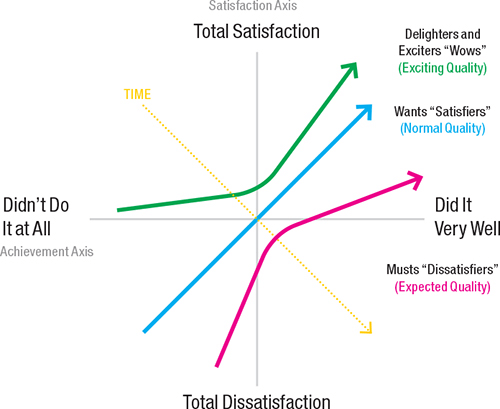
Developed by Japanese professor Noriako Kano and his team in 1984, the Kano model is a set of guidelines and techniques used to categorize and prioritize customer needs, guide product development and improve customer satisfaction.
The idea behind the Kano model is that Customer Satisfaction depends on the level of Functionality that a feature provides (how well a feature is implemented).
The model contains two dimensions:
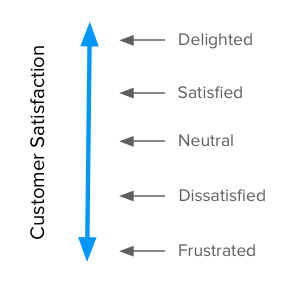
Satisfaction, also seen as Delight or Excitement (Y-axis) that goes from Total Satisfaction (Delighted or Excited) to Total Dissatisfaction (Frustrated or Disgusted).
 Source: The Complete Guide to the Kano Model
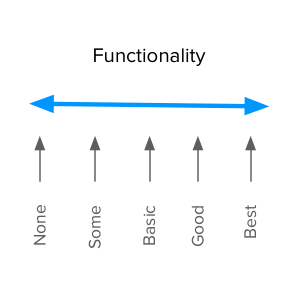
Functionality, also seen as Achievement, Investment, Sophistication or Implementation (X-axis) that shows how well we’ve executed a given feature. It goes from Didn’t Do It at All (None or Done Poorly) to Did It Very Well.
 Source: The Complete Guide to the Kano Model
Kano classifies features into four broad categories depending on the customer’s expectations (or needs):
 Source: Product Roadmaps Relaunched by C. Todd Lombardo, Bruce McCarthy, Evan Ryan, Michael Connors
Let’s take a restaurant business, for example:
The Kano model is useful when you’re prioritizing product features based on the customer’s perception of value:
Perception is the key word here. If the customer lives in an arid climate, rain-sensing wipers may seem unimportant to them, and there will be no delight. Using the Kano model (or any other model incorporating customer value) requires you to know your customer well. —Product Roadmaps Relaunched by C. Todd Lombardo, Bruce McCarthy, Evan Ryan, Michael Connors
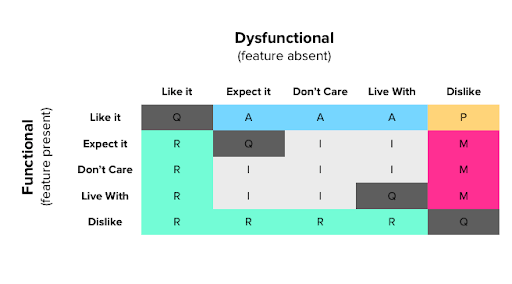
To determine what’s your customers’ perception of your product, you must ask them a set of questions for each of the features they use:
Users are asked to answer with one of five options:
An example Kano questionnaire:
Then, we collect the functional and dysfunctional answers in what is called an evaluation table.
 Source: The Complete Guide to the Kano Model
To learn more about categorizing features in the evaluation table, you can check Daniel Zacarias’ post on the topic.
Weighted Scoring Prioritization is another framework that helps you decide what to put on your product roadmap.
The prioritization score is a weighted aggregation of drivers that are used to quantify the importance of a feature. It is calculated using a weighted average of each feature’s score across all drivers, which can serve to represent any prioritization criteria you’d like.
The weight given to each driver (out of a total of 100%) determines the driver’s relative contribution to the final score.
You can use a simple spreadsheet to create a scorecard or a robust product management system like Productboard to visualize and automate the scoring process.
Here’s how to use the Weighted Scoring Prioritization framework:
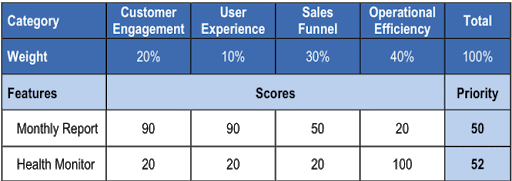
Here’s an example scorecard:
 Source: How to Use a Scorecard to Prioritize Features
Each feature’s score is multiplied by the driver’s weight, then added to the total Priority score. For example: 90*20% + 90*10% + 50*30% + 20*40% = 50 Total Priority.
productboard makes the weighted scoring process intuitive by providing you with a visual interface to define the drivers’ weights. You can also filter features based on their prioritization score.
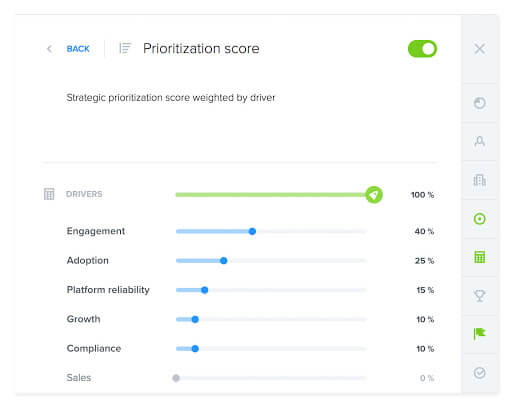
Weighting drivers in Productboard
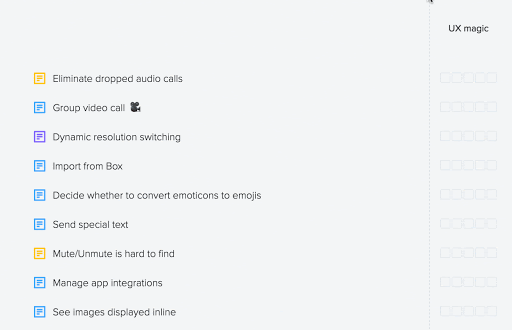
Scoring features in Productboard
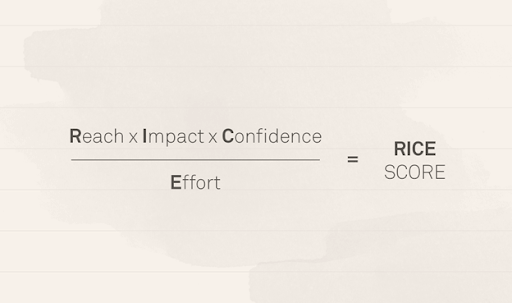
The RICE framework is a straightforward scoring system developed by the brilliant product management team at Intercom.
RICE stands for the four factors that Intercom uses to evaluate product ideas.
Reach
How many people will be affected by that feature in a given time? For example, “users per month” or “conversions per quarter.”
Example: 1000 of our user base open this page every month, and from that, 20% of people select this feature. The total Reach is going to be 200 people.
Impact
Intercom scores the impact of a specific feature on an individual person level on a scale from 0.5 to 3.
Confidence
As we previously mentioned in this guide, the number one problem for product managers is prioritizing features without customer feedback. The Confidence score in the RICE method takes into account this problem and allows you to score features based on your research data (or lack of it).
Confidence is a percentage value:
Example: “I have data to support the reach and effort, but I’m unsure about the impact. This project gets an 80% confidence score.”
Effort
Effort is the total amount of time a feature will require from all team members. Effort is a negative factor, and it is measured in “person-months.”
Example:
This feature will take 1 week of planning, 4 weeks of design, 3 weeks of front-end development, and 4 weeks of back-end development. This feature gets an effort score of 3 person-months.
Once you have all of the four factors scored, you use the following formula to calculate the RICE score for each feature:
 Source: The resulting score measures “total impact per time worked.”
Intercom has made our life easier by providing a spreadsheet that we can use to calculate the RICE score automatically. You want to work on the features with the highest RICE score first!
If you’re looking for a speedy prioritization framework, look no further because the ICE Scoring Model is even more straightforward than the RICE framework.
In the words of Anuj Adhiya, author of “Growth Hacking for Dummies”: think of the ICE scoring model as a minimum viable prioritization framework.
It’s an excellent starting point if you’re just getting into the habit of prioritizing product initiatives, but it lacks the data-informed objectivity of the rest of the frameworks in this guide.
The model was popularized by Sean Ellis, the person credited for coining the term “growth hacking.” It was initially used to score and prioritize growth experiments but later became popular among the product management community.
ICE is an acronym for:
Each of these factors is scored from 1–10, and the total average number is the ICE score.
You can use this simple spreadsheet built by a member of the Growth Hackers community to calculate your ICE scores.
One of the issues with that model is that different people could score the same feature differently based on their own perceptions of impact, confidence, and ease. The reality is that the goal of the ICE model is to provide you with a system for relative prioritization, not a rigorous data-informed calculator.
“The point is that the “good enough” characteristic of the ICE score works well BECAUSE it is paired with the discipline of a growth process.” —Anuj Adhiya, The Practical Advantage Of The ICE Score As A Test Prioritization Framework
To minimize inconsistent product assessments, make sure to define what the ICE rankings mean. What does Impact 5, Confidence 7, Ease 3, and so on, mean for you and your team.
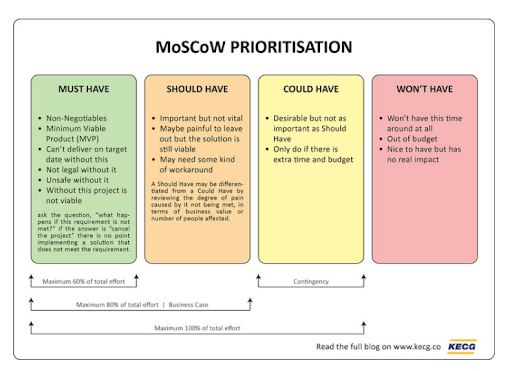
The MoSCoW prioritization framework was developed by Dai Clegg while working at Oracle in 1994 and first used in the Dynamic Systems Development Method (DSDM)—an agile project delivery framework.
The MoSCoW method helps you prioritize product features into four unambiguous buckets typically in conjunction with fixed timeframes.
This quirky acronym stands for:
Features are prioritized to deliver the most immediate business value early. Product teams are focused on implementing the “Must Have” initiatives before the rest of them. “Should Have” and “Could Have” features are important, but they’re the first to be dropped if resources or deadline pressures occur.
 Source: Task Prioritisation Hack using MoSCoW Method
“Must Have” features are non-negotiable requirements to launch the product. An easy way to identify a “Must Have” feature is to ask the question, “What happens if this requirement is not met?” If the answer is “cancel the project,” then this needs to be labeled as a “Must Have” feature. Otherwise, move the feature to the “Should Have” or “Could Have” boxes. Think of these features as minimum-to-ship features.
“Should Have” features are not vital to launch but are essential for the overall success of the product. “Should Have” initiatives might be as crucial as “Must Haves” but are often not as time-critical.
“Could Have” features are desirable, but not as critical as “Should Have” features. They should only be implemented if spare time and budget allow for it. You can separate them from the “Could Have” features by the degree of discomfort that leaving them out would cause to the customer.
“Won’t Have” features are items considered “out of scope” and not planned for release into the schedule of the next product delivery. In this box, we classify the least-critical features or tasks with the smallest return on investment and value for the customer.
When you start prioritizing features using the MoSCoW method, classify them as “Won’t Haves” and then justify why they need a higher rank.
People often find pleasure in working on pet ideas that they find fun instead of initiatives with higher impact. The MoSCoW method is a great way to establish strict release criteria and prevent teams from falling into that trap.
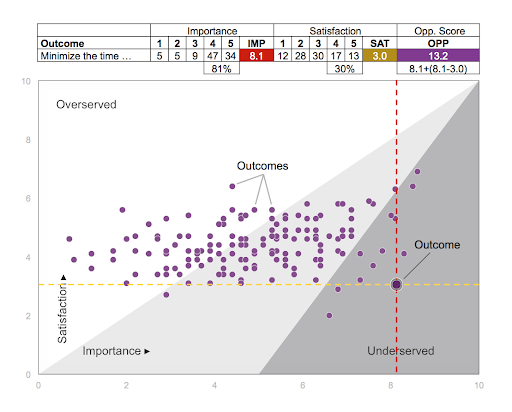
The roots of Opportunity Scoring, also known as a gap analysis or opportunity analysis, trace back to the 1990s and the concept of Outcome-Driven Innovation (ODI), popularized by the researcher Anthony Ulwik.
Opportunity scoring is a prioritization framework that evaluates the feature importance and satisfaction for customers. This method allows us to identify features that customers consider essential but are dissatisfied with.
To use the Opportunity Scoring method, you must conduct a brief survey asking customers to rank each feature from 1 to 10 according to two questions:
Then, you use your aggregated numbers in the following formula:
Importance + (Importance – Satisfaction) = Opportunity
The features with the highest importance score and lowest satisfaction will represent your biggest opportunities.
“If 81% of surgeons, for example, rate an outcome very or extremely important, yet only 30% percent rate it very or extremely satisfied, that outcome would be considered underserved. In contrast, if only 30% of those surveyed rate an outcome very or extremely important, and 81% rate it very or extremely satisfied, that outcome would be considered over-served.”
—Eric Eskey, Quantify Your Customer’s Unmet Needs
 Source: Quantify Your Customer’s Unmet Needs
Once you know your most viable opportunities, determine what it takes to connect these gaps. You need to take into consideration any resources required to deliver the improved feature.
The opportunity scoring formula is an effective way to discover new ways to innovate your product and low-hanging-fruit opportunities to improve satisfaction metrics such as a Net Promoter Score (NPS)
Value vs. Complexity Quadrant
Kano Model
Weighted Scoring
RICE
ICE
MoSCoW
Opportunity Scoring
. . .
Productboard is a product management system that enables teams to get the right products to market faster. Built on top of the Product Excellence framework, Productboard serves as the dedicated system of record for product managers and aligns everyone on the right features to build next. Access a free trial of Productboard today.